

Hi! Its not possible to download this yet due to the constraint with the payouts from Stripe.
Overview
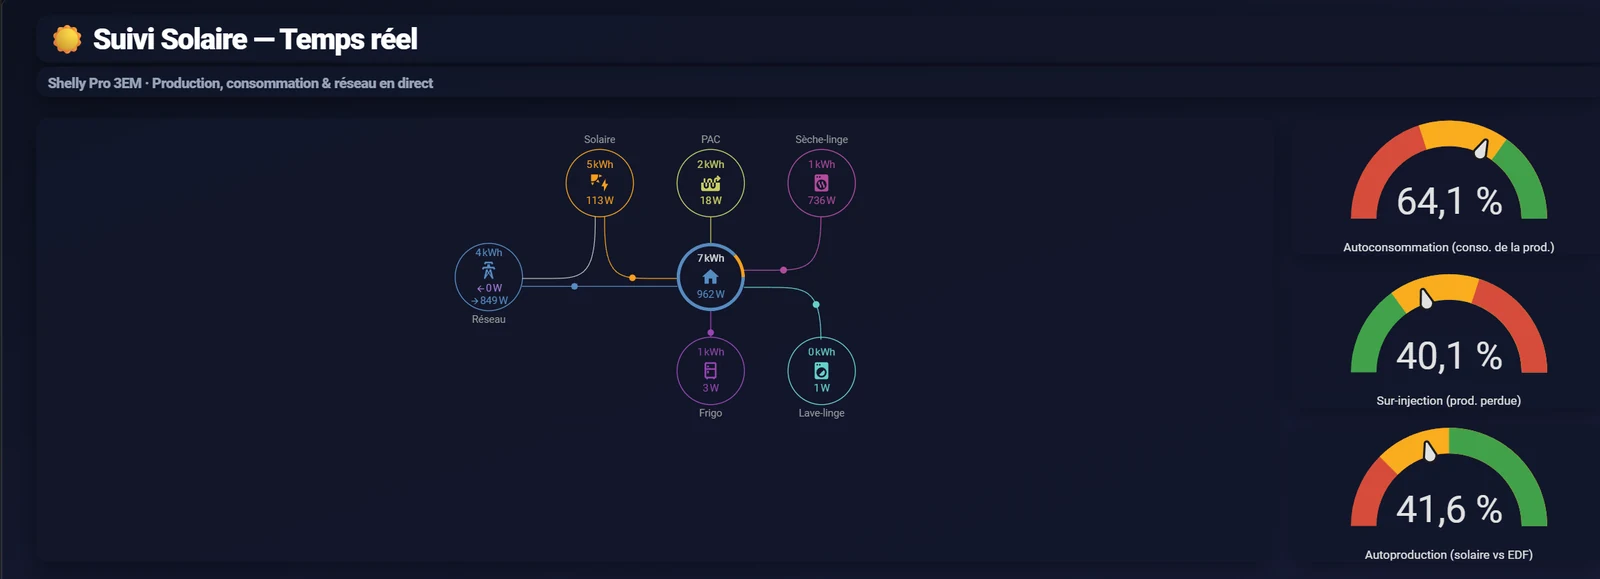
A complete 3-view energy dashboard built on the Drag & Drop Card.
Energie view: live power-flow diagram (grid, PV, house + 4 individual loads), three gauges (self-consumption, over-injection, self-production), a 6-tile daily balance, two real-time ApexCharts (24 h and 2 h), weekly/monthly Linky index tiles, and two diagnostic comparison charts.
Historique view: 30 days of statistics - production, grid import, self-consumed, injected, cost, savings, self-consumption and self-production rates.
Mode d'emploi view: a built-in user guide listing every entity to replace, plus quick customisation tips.
Fully responsive: separate hand-tuned layouts for desktop, tablet (landscape and portrait) and mobile (landscape and portrait). Dark theme with a deep-blue gradient background.
Note: the labels are written in French; every title and label is editable from the card editor.
What’s included
Package
Full dashboard JSON
Version
1.0.0
License
All Rights Reserved
Custom cards
2
Requirements
HACS custom cards (required):
drag-and-drop-card (Drag & Drop Card)
power-flow-card-plus
apexcharts-card
Entities to provide (rename them to yours in the card editor):
Instant power: signed grid power (+ import / - export), PV production, house consumption.
Daily totals: grid import, PV production, self-consumed, injected, electricity cost, solar savings.
Weekly and monthly totals: grid import, cost, self-consumed, savings.
Rates: self-consumption, over-injection, self-production.
Optional individual loads shown in the flow card: heat pump, fridge, tumble dryer, washing machine.
Built and tested with a Shelly Pro 3EM plus a Linky/teleinfo reader, but any power meter exposing the same sensors works.
Install these custom cards before importing this package.
custom:apexcharts-card
custom:power-flow-card-plus
Installation notes
- Install the three HACS cards listed under Requirements, then reload your browser cache.
- Create an empty dashboard: Settings > Dashboards > Add dashboard, then Take control.
- Add a view of type Panel and put a single Drag & Drop Card in it.
- Open the card toolbar, choose Import design and select the JSON of this package. The 26 cards and the five breakpoint layouts load at once.
- Open the Mode d'emploi view (shipped in the extra_views key of the same JSON, to be pasted in the raw configuration editor): it lists every entity used, grouped by role.
- Replace each entity with your own (card three-dot menu > Edit > Entity).
- Adjust your electricity tariffs in the cost and savings sensors, then delete the guide view.
The JSON also contains the Historique view (30 days of statistics, native statistics-graph cards) under extra_views.
Layout positions are stored per breakpoint (desktop, tablet landscape/portrait, mobile landscape/portrait), so drag and resize from the device you want to tune. If the card ever boots blank after an import, clear the browser key ddc_local_<storage_key> in localStorage so it reloads the layout from the dashboard config.
Version notes
LatestInitial version
Version history